Performance Marketing KPIs: Which Metrics Matter at Each Stage of the Funnel
Author: Richa Naik, Digital Marketing Manager
Date : 30 October 2026
Performance marketing produces more data than any team can use. Dashboards show dozens of figures, and most of them describe activity rather than results. The skill is not collecting metrics but choosing the few that explain what is happening at each stage, and ignoring the rest until they become relevant.
This guide organizes key performance indicators by funnel stage, shows how they connect, and ends with a template for a one-page dashboard. It does not define pricing models in detail; for that, see our guides to CPA, CPC, and CPM. Here the subject is what to measure once campaigns are running.
The Principle: One Primary Metric per Stage
Each funnel stage has a job, and each job has a primary metric. Supporting metrics help you diagnose problems, but they should not compete for attention. Too many headline numbers lead to arguments about which one matters.
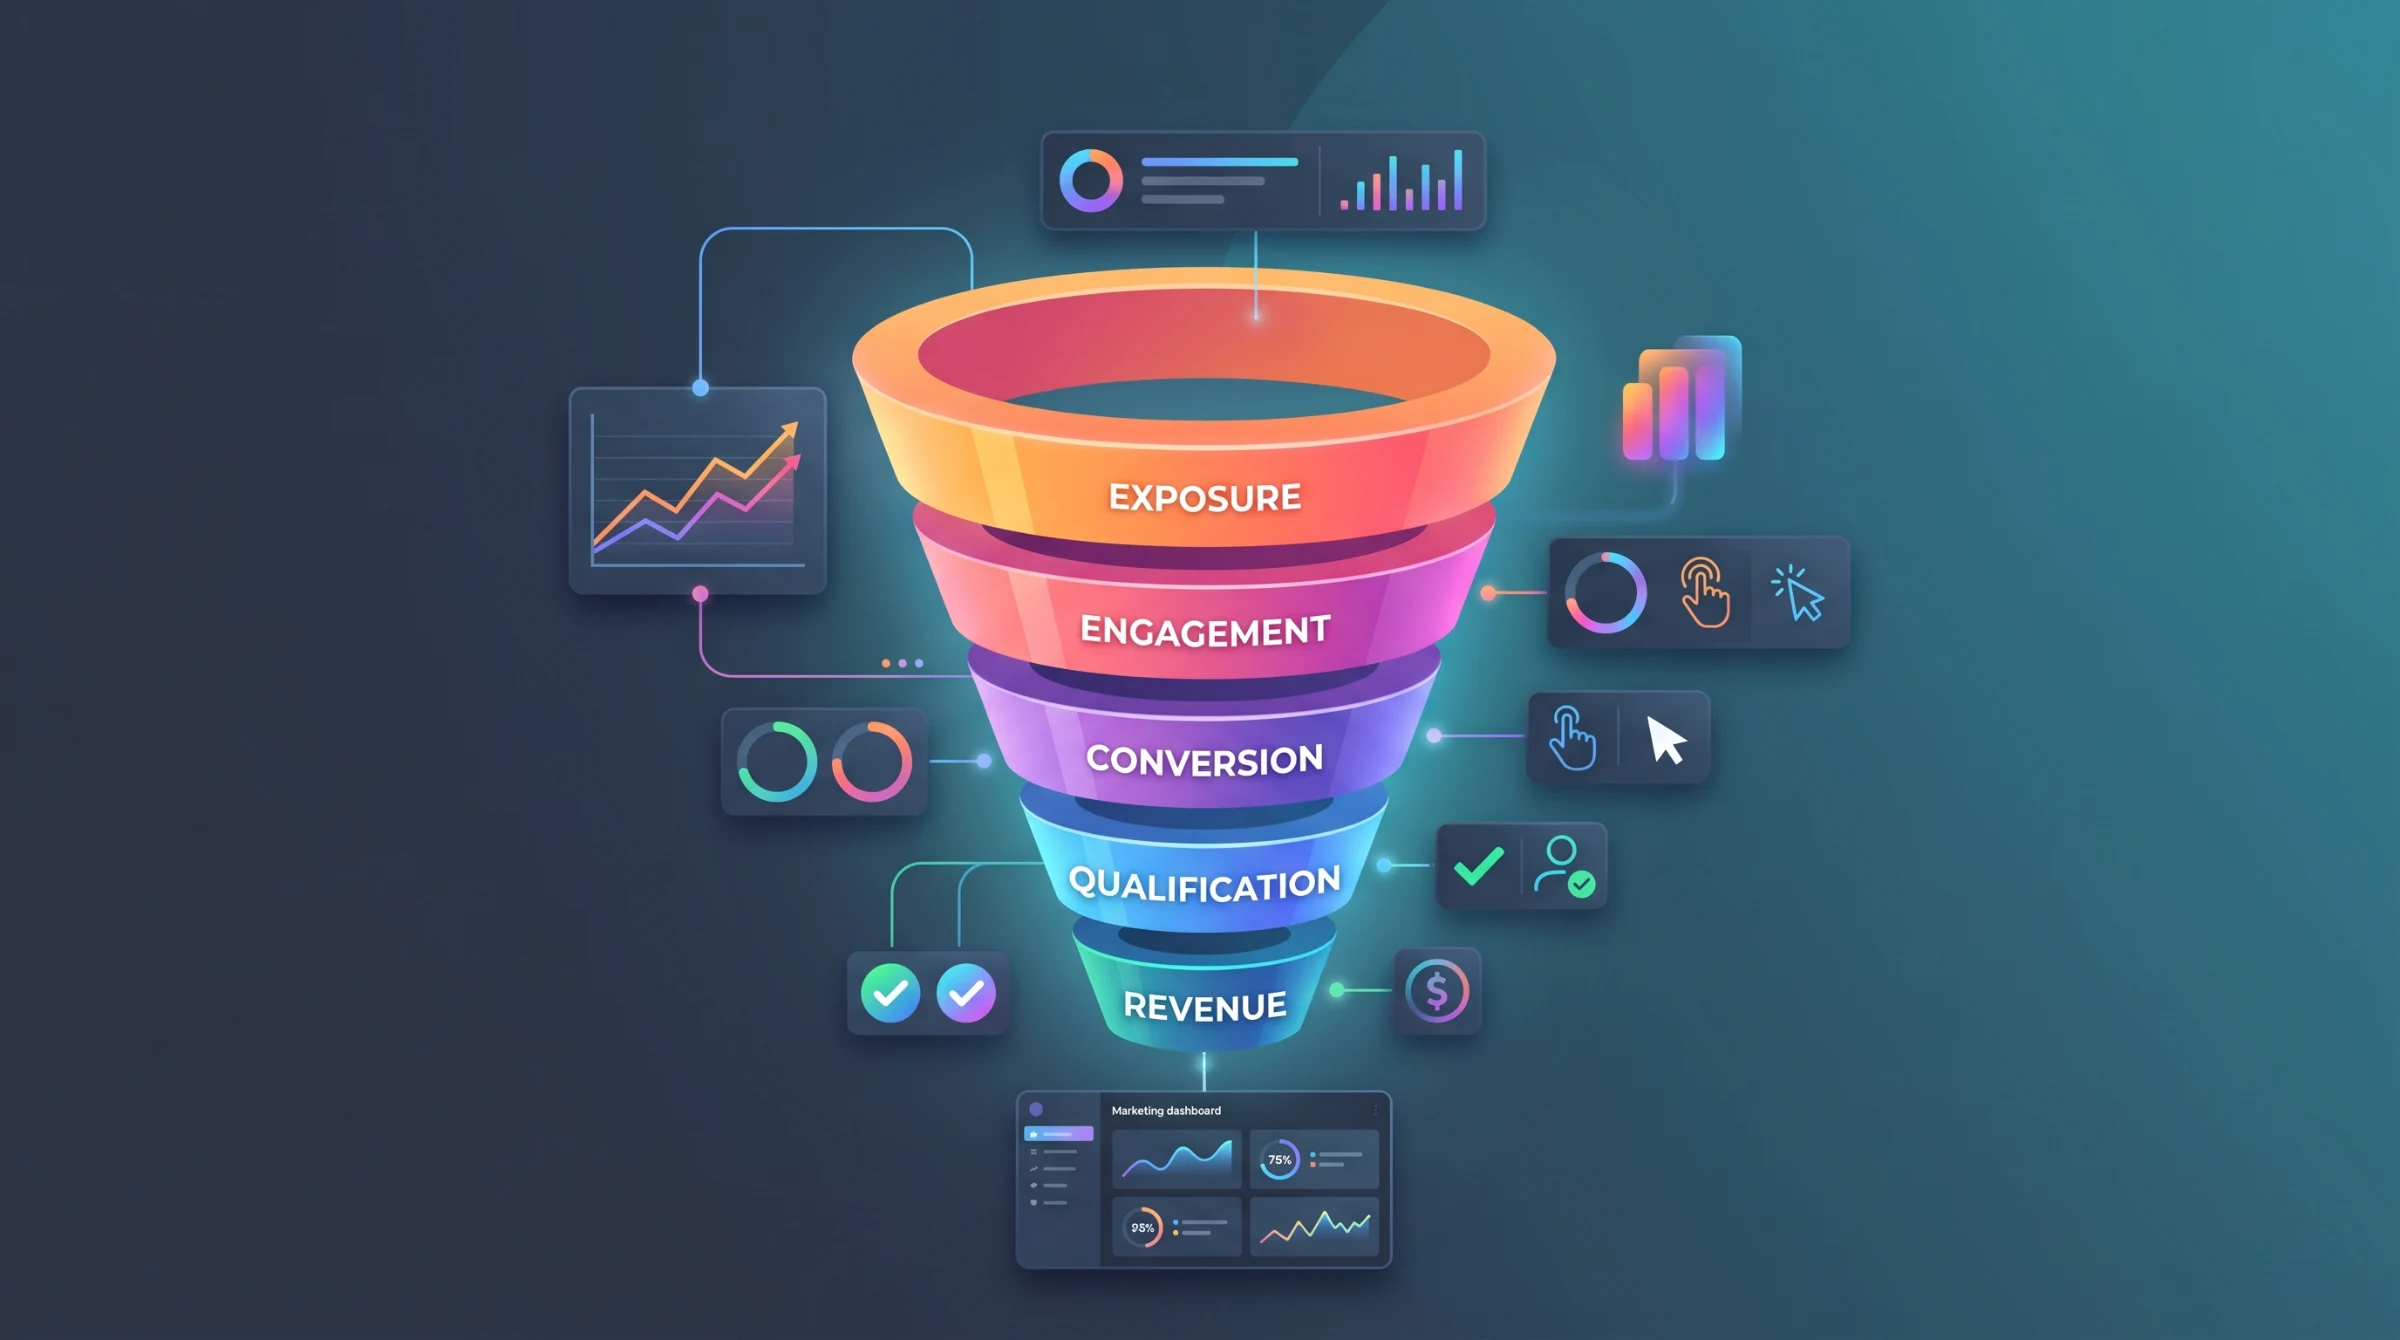
The funnel used here has five stages: exposure, engagement, conversion, qualification, and revenue.
Stage 1: Exposure
Question answered: Are the right people seeing the ads?
Primary metric: Reach or impressions among the target audience.
Supporting metrics: viewable impression rate, frequency, share of voice in search (for example impression share), and cost per thousand impressions.
Exposure metrics matter most for awareness-led campaigns. For search campaigns focused on capturing demand, impression share helps show how much of the available demand you are missing because of budget or rank.
Stage 2: Engagement
Question answered: Do people who see the ads care enough to act?
Primary metric: Click-through rate for ads, or engaged sessions on the site.
Supporting metrics: cost per click, bounce or engagement rate, pages per session, scroll depth, and video watch time.
Treat click-through rate carefully. It reflects how appealing the ad is, not how valuable the clicker is. A curiosity-driven ad can have a high rate and a poor outcome. Review it alongside what happens after the click.
Stage 3: Conversion
Question answered: Do visitors take the intended action?
Primary metric: Conversion rate, and cost per conversion (often called cost per lead or cost per acquisition depending on the action).
Supporting metrics: form start rate, form completion rate, call connection rate, and conversion rate by device.
The numerator depends on what you count as a conversion. If "conversion" includes low-value actions such as page scrolls or newsletter signups mixed with lead forms, the rate becomes meaningless. Keep a short list of key events that map to business outcomes, and keep the rest as diagnostics.
Stage 4: Qualification
Question answered: Are the conversions the kind we want?
Primary metric: Cost per qualified lead.
Supporting metrics: lead-to-qualified rate, rejection reasons, time to first contact, and lead score distribution.
This stage is where many reports stop too early. A campaign with a low cost per lead and a poor qualified rate is expensive in practice. The criteria are covered in lead quality versus lead volume.
Stage 5: Revenue
Question answered: Does the spend pay back?
Primary metric: Cost per customer and return on ad spend (ROAS) or marketing efficiency against gross profit.
Supporting metrics: customer acquisition cost, payback period, average deal value, and lifetime value where it can be estimated reliably.
ROAS is revenue divided by ad spend. It ignores cost of goods, delivery, and overhead, so a high ROAS can still lose money if margins are thin. Where possible, report against gross profit.
Illustrative example. A campaign spends $5,000 and generates $20,000 in revenue, a ROAS of 4. If gross margin is 25%, gross profit is $5,000. The campaign returns its cost and nothing more, before any other expenses.
How the Metrics Connect
Metrics at adjacent stages multiply. Cost per customer equals cost per click divided by the product of click-to-lead rate, lead-to-qualified rate, and qualified-to-customer rate. That relationship gives you a diagnostic method.
When cost per customer rises, decompose it. Did click cost rise? Did the landing page conversion fall? Did sales close fewer qualified leads? Each answer points to a different owner and a different fix. The lead generation framework uses the same stage logic for troubleshooting.
Leading and Lagging Indicators
Some metrics move quickly and some slowly.
- Leading indicators: click-through rate, conversion rate, cost per lead. They change within days and guide short-term decisions.
- Lagging indicators: cost per customer, payback period, lifetime value. They change over weeks or months and confirm whether the strategy works.
Use leading indicators to steer and lagging indicators to judge. Do not wait for lagging data to fix an obvious tracking fault, and do not make large budget decisions on a week of leading data alone.
Metrics That Mislead
- Blended averages. Combining branded and non-branded search, or retargeting and prospecting, hides what each does. Report them separately.
- Platform-reported conversions taken at face value. Platforms use their own attribution rules and may count the same conversion that another platform counts. Compare against your analytics and CRM, and review attribution models for lead generation.
- Vanity totals. Followers, impressions, and raw clicks rarely predict revenue on their own.
- Short windows. If your sales cycle is long, a month of data may show cost per lead but not cost per customer.
A One-Page Dashboard Template
Build a single page that a decision-maker can read in two minutes.
- Header row: spend, qualified leads, cost per qualified lead, customers, cost per customer.
- Trend chart: cost per qualified lead by week, with a target line.
- Channel table: spend, leads, qualified leads, and cost per qualified lead by channel and campaign type.
- Diagnostics block: click-through rate, conversion rate, and lead-to-qualified rate, shown against previous period.
- Notes: changes made this period and planned tests.
Before you trust the numbers, verify the data pipeline using the conversion tracking audit checklist. Reports built on faulty tracking are worse than no reports, because they look credible.
Setting Targets
Targets come from unit economics, not from industry averages. Work backward from the gross profit per customer and the margin you need, as shown in the CPA payout example in our CPA marketing guide. Then set a target for cost per qualified lead using your qualified-to-customer rate. Review targets quarterly, since close rates and prices change.
Where you want help building reporting that connects ad spend to qualified leads and revenue, our performance marketing services include dashboard setup and ongoing analysis.
A Worked Decomposition
Illustrative example. Last month, a program spent $6,000 at an average cost of $3 per click, producing 2,000 clicks. Landing page conversion was 5%, giving 100 leads. Thirty became qualified, and 6 became customers. Cost per lead was $60, cost per qualified lead $200, and cost per customer $1,000.
This month the same spend gives 2,000 clicks again, but the cost per customer is $1,500. Decomposing the funnel shows click cost unchanged, landing page conversion unchanged, qualified rate unchanged, and qualified-to-customer falling from 20% to 13% as sales closed only 4 deals. The marketing numbers are stable; the change sits downstream. Without the stage-by-stage view, the team might have cut the budget or rewritten ads, which would not have addressed the real cause.
Segmenting KPIs for Sharper Decisions
Aggregate numbers conceal differences. Break each primary metric into segments that map to decisions you can make: channel, campaign type, device, geography, and audience temperature (new visitors versus returning). Segment only as far as volume supports; a segment with a handful of conversions produces noise and invites overreaction. Where you do have enough data, segmentation often shows that a minority of campaigns generates most qualified leads, and that a few consume budget with little return.
Reporting Cadence
- Daily: spend pacing and anomalies only.
- Weekly: leading indicators and active tests.
- Monthly: qualification and cost per customer, with commentary on changes.
- Quarterly: targets, channel mix, and unit economics.
A consistent cadence prevents both neglect and overreaction.
Choosing KPIs for Different Goals
Not every program shares the same funnel. A local service business may count phone calls as its main conversion, so call connection rate and cost per qualified call belong on the dashboard. An ecommerce store may focus on ROAS, average order value, and new-customer share. A software company with a free trial may need trial-to-paid conversion and payback period. Start from the question "what outcome pays the bills?" and trace the stages backward from there. Metrics that do not connect to that outcome can be dropped or kept as diagnostics.
Frequently Asked Questions
What are the most important KPIs in performance marketing?
They depend on the goal. For lead generation, cost per qualified lead and cost per customer are usually the most informative. For ecommerce, ROAS and contribution margin matter more.
How often should I review KPIs?
Check leading indicators weekly, and review lagging indicators monthly or quarterly, depending on the sales cycle.
Is ROAS the same as ROI?
No. ROAS compares revenue with ad spend. ROI compares profit with total cost, which includes more than advertising.
How many KPIs should a dashboard show?
Few enough that each one prompts a decision. A handful of headline metrics with supporting diagnostics is usually enough.
Key Takeaways
Choose one primary metric per funnel stage, connect them so you can decompose problems, separate leading from lagging indicators, and set targets from your own economics. A short, trusted dashboard will serve you better than a long one nobody reads.
Ready to put this into practice? Talk to our team about building KPI reporting that connects your ad spend to qualified leads and revenue.