A/B Testing for Paid Campaigns: How to Build a Testing Roadmap That Produces Reliable Answers
Author: Richa Naik, Digital Marketing Manager
Date : 30 October 2026
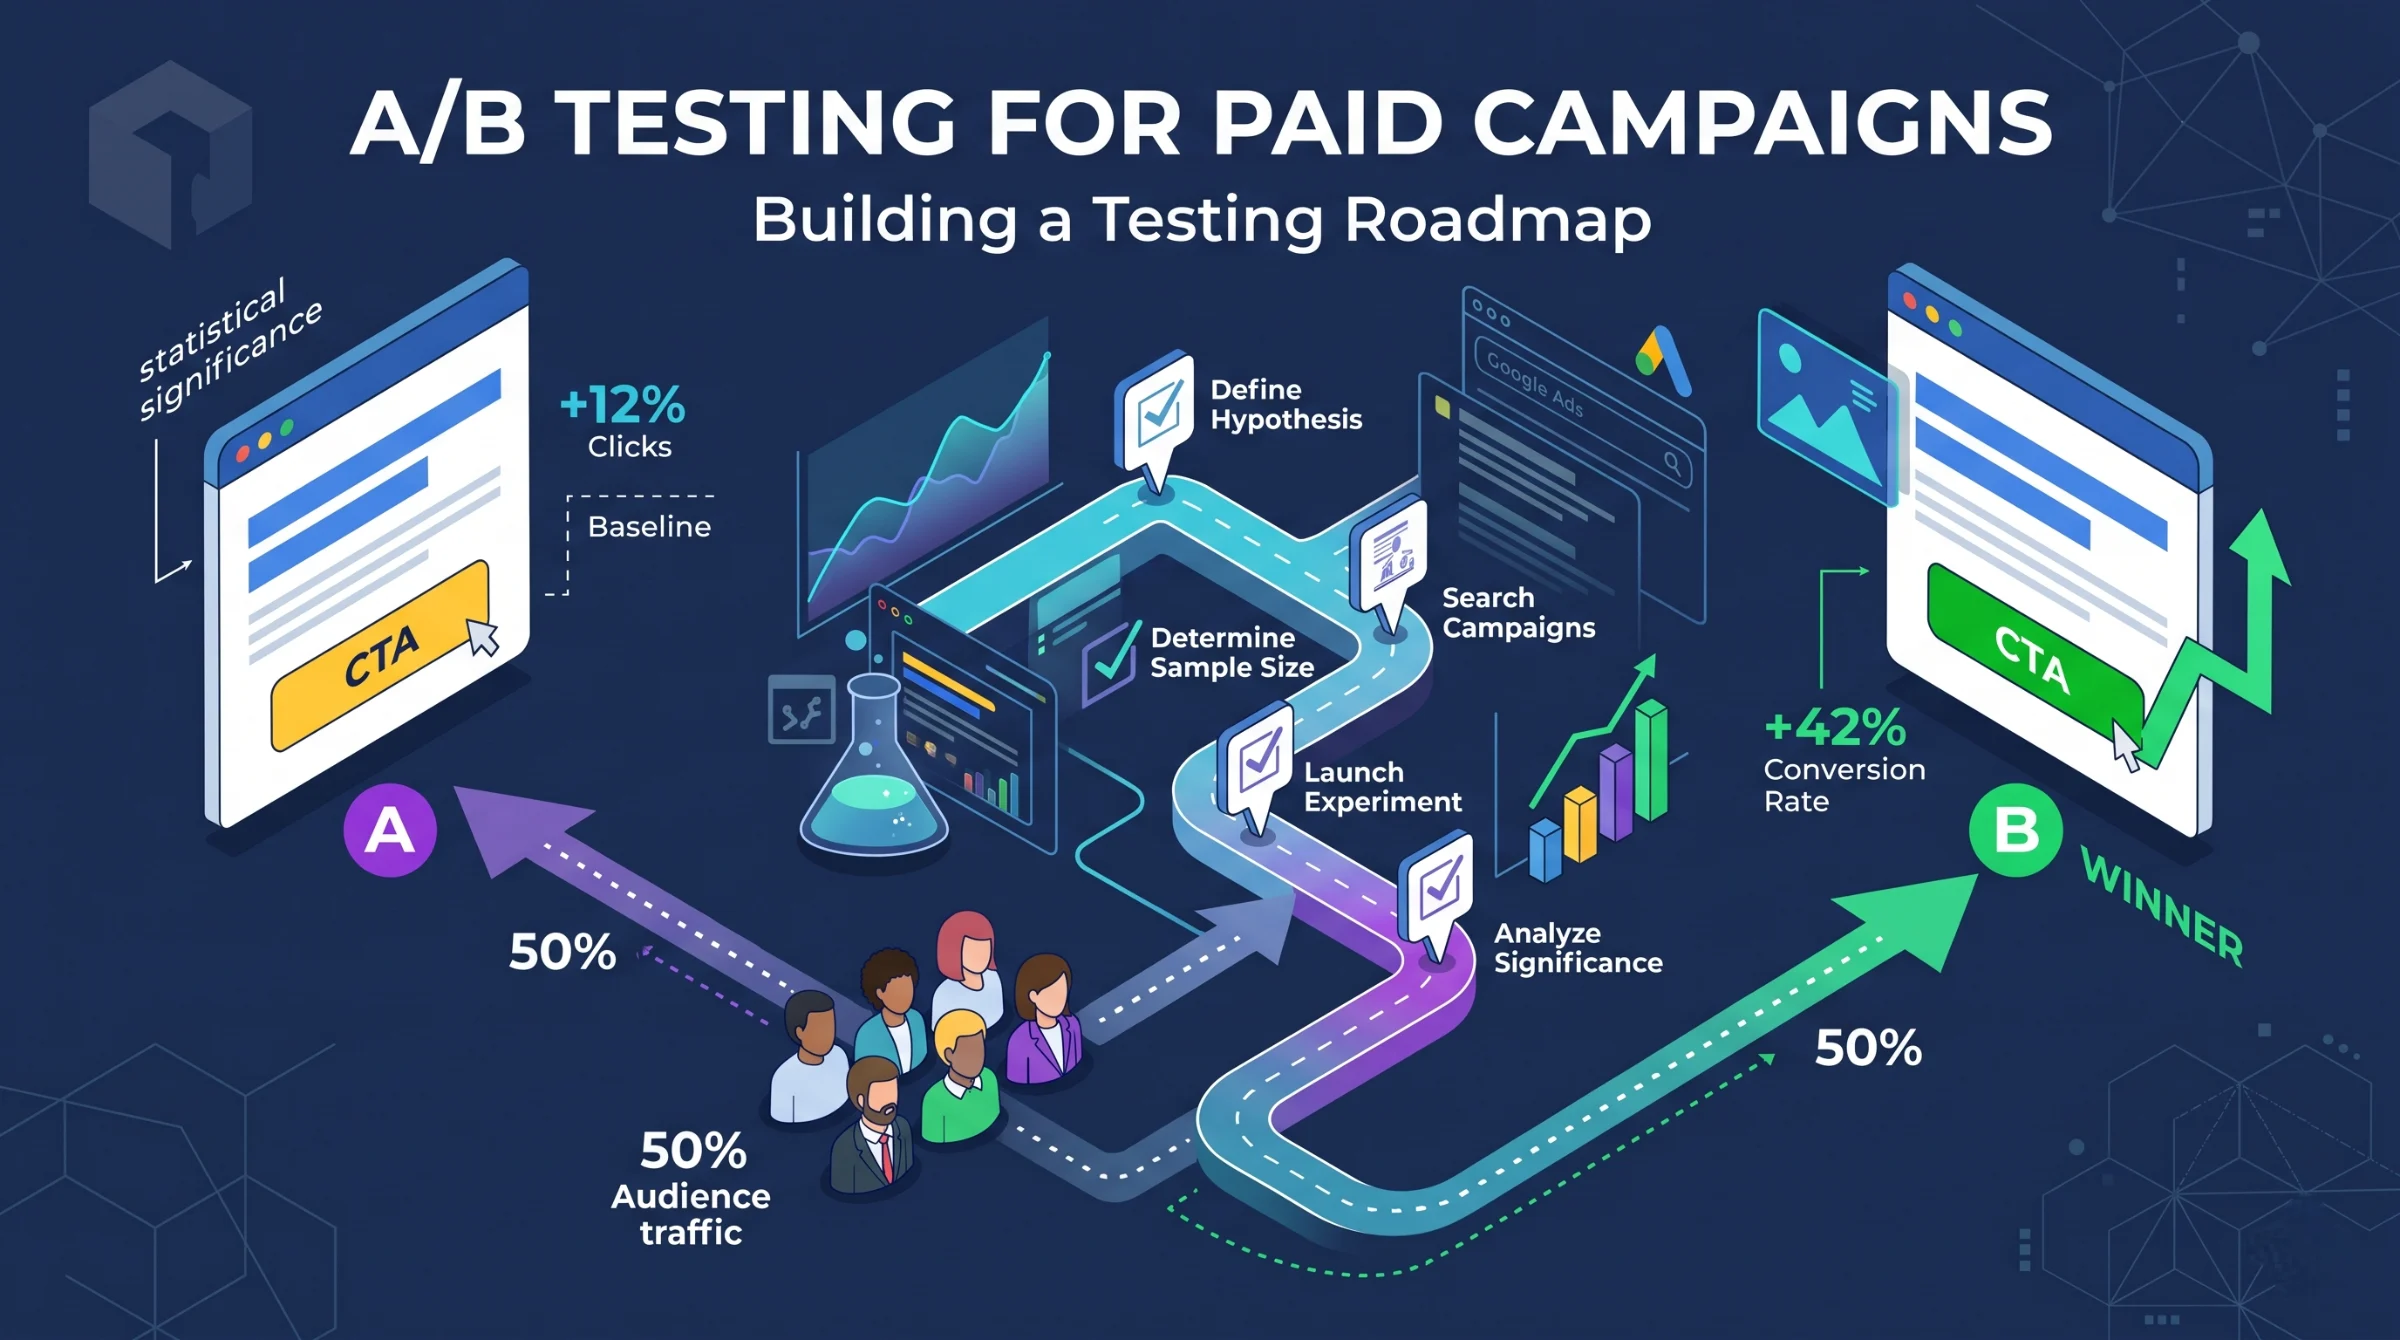
Testing is the discipline that separates steady improvement from random change. Without it, a team alters ads and pages, sees results move, and credits whatever it changed last. With it, each change becomes a question with an answer you can rely on.
This article explains how to plan a testing roadmap for paid campaigns: what to test, how to write a hypothesis, how to size and run a test, and how to avoid the mistakes that produce false winners. The methods draw on standard practice in online controlled experiments, including the guidance in Kohavi, Tang, and Xu's textbook on the subject. For page-specific ideas, pair this with our guide to landing page conversion.
What an A/B Test Is, and What It Is Not
In an A/B test, you split comparable traffic randomly between two versions that differ in one respect, then compare outcomes. Randomization is what allows you to attribute a difference to the change rather than to timing or audience.
These are not A/B tests:
- Running version B this week and comparing it with version A last week. Seasonality, news, and budget changes confound the result.
- Running two versions to different audiences and comparing. The audiences differ, so the result is mixed.
- Letting the platform rotate ads and picking the one with more clicks. Rotation is often optimized toward the likely winner, which is not a balanced split.
Use the platform's experiment tools where available, such as campaign experiments in Google Ads or the A/B testing feature in Meta's ad tools, since they handle random assignment for you.
Write the Hypothesis First
A good hypothesis has four parts: the change, the expected effect, the metric, and the reason.
Template: "If we [change], then [metric] will [increase/decrease] because [reason]."
Example: "If we state the service area in the ad headline, then the share of clicks that become qualified leads will rise, because out-of-area visitors will be less likely to click."
The reason matters, because it lets you learn something even when the test loses. A result that contradicts the reason tells you your understanding of the audience was wrong, which is useful.
Choose the Right Metric
Pick one primary metric before the test begins. For lead generation, rank candidates in this order of preference:
- Cost per qualified lead or qualified-lead rate
- Cost per lead or lead conversion rate
- Click-through rate
Click-through rate is quick to move and easy to measure, but it can rise while qualified leads fall. Use it as a diagnostic, not as the winner criterion, unless the test targets awareness. See the KPI guide for how metrics relate.
Set guardrail metrics as well, such as lead quality and cost, to catch cases where a gain on the primary metric causes harm elsewhere.
What to Test, in Priority Order
Impact tends to be highest where the visitor makes the biggest decisions.
- Offer and value proposition. What the person receives, and at what commitment.
- Audience and targeting. Which segments, keywords, or placements.
- Landing page headline and form. The first screen and the number of fields.
- Ad copy and creative. Angles, formats, and visuals.
- Bidding strategy and structure. Manual versus automated, campaign consolidation.
- Minor details. Button colors, small copy edits. These rarely produce meaningful differences unless volume is very large.
Sample Size and Duration
The most frequent testing error is calling a winner too early. Small samples produce random swings that look like effects.
Illustrative example. Version A gets 5 conversions from 100 visitors, and version B gets 8 from 100. B looks 60% better, but the difference is within what chance could produce. With so few conversions, the observed gap carries little information.
Before the test:
- Estimate your baseline conversion rate from recent data.
- Decide the smallest improvement worth acting on.
- Use a sample size calculator (many free ones exist) to estimate visitors or conversions needed per version.
- If the required traffic would take too long, test a bigger change, use a higher-volume metric, or accept lower confidence knowingly.
Run tests for full weeks so that day-of-week patterns balance out, and do not stop the moment results look good. Peeking and stopping on a favorable reading inflates false positives. Set the end date or sample size in advance.
Interpreting Results
- Statistical significance indicates how unlikely the observed difference is under no true difference. A common threshold is 95% confidence, but it is a convention. Confidence does not tell you the effect is large.
- Effect size tells you whether the difference matters in practice. A tiny but statistically significant gain may not repay the work.
- Segments can reveal that a variant wins on mobile and loses on desktop. Treat segment findings as hypotheses for follow-up tests, since slicing results many ways produces false patterns.
- Inconclusive results are results. They show that the change did not matter enough to detect, which frees you to test something bolder.
Common Errors to Avoid
- Changing several things at once and not knowing which mattered
- Altering budgets, bids, or targeting during the test
- Running overlapping tests that affect the same audience
- Declaring a winner on clicks when the goal is qualified leads
- Ignoring the learning period of automated bidding, which can distort early readings
- Not recording results, so the team repeats old tests
Building the Roadmap
Keep a simple backlog. For each idea, record the hypothesis, expected impact, confidence, and effort, then rank by value over effort. Aim to have one or two tests running per channel at any time, and fund them from the experiment layer of your budget, as described in ad budget allocation and scaling.
After each test, write a short note: what changed, what happened, what you will do next, and what you learned. Over time, this library becomes one of your most useful assets.
Ad creative is among the most testable areas, and tests there feed the refresh cycle explained in our creative fatigue guide. For search accounts, test structure and bidding changes with the methods in the CPC guide.
If you want a testing program run alongside your campaigns, our performance marketing services include experiment design and reporting.
A Worked Test Plan
Illustrative example. A lead form converts 4% of visitors, with about 3,000 visitors a week. The team wants to detect an improvement from 4 to 5%. A sample size calculator suggests several thousand visitors per version are needed for reasonable power, which means roughly three to four weeks of traffic split evenly. The test compares the current form with a shorter one. The primary metric is qualified leads per visitor, and the guardrail is the share of leads accepted by sales. The team writes the end date in the plan and agrees not to inspect the winner before it.
If the shorter form raises submissions but lowers the accepted share, the result is mixed. The team can then test a middle option rather than choose between extremes.
Testing in Platforms With Automated Delivery
Automated systems add complexity. Platforms may optimize delivery toward the variant that seems to perform, which can skew exposure unless the tool is designed for experiments. Use the platform's experiment function where it exists, and give automated bidding time to learn before reading results. Avoid stacking several experiments on the same campaign, and note any external events, such as a promotion or outage, that occurred during the test window.
Keeping a Test Log
Record the date, hypothesis, variants, metric, sample, result, and decision for each test. Review the log quarterly to spot patterns, such as which angles repeatedly win. A log also stops new team members from rerunning old experiments.
Bigger Swings Versus Small Refinements
Programs with limited traffic should favor large, meaningful changes over fine adjustments, since only large effects can be detected reliably. Test a different offer, a distinctly different angle, or a restructured form instead of a changed button label. Once a strong baseline exists and traffic is high, refinements become worth testing. Many teams find that the early rounds of testing deliver the largest gains, and later tests bring smaller increments, which is a normal pattern and not a sign of failure.
Communicating Results to Stakeholders
Present each test as a short story: what we believed, what we changed, what happened, and what we will do. Show the size of the effect with a range where possible, and be clear about confidence and limits. If a test failed to find a winner, say so and explain the next step. This habit builds trust in the testing program, and it prevents the common pattern of stakeholders remembering only the wins and doubting the process when results are flat.
Frequently Asked Questions
How long should an A/B test run?
Until it reaches the planned sample size and has covered full weekly cycles. Avoid stopping early because results look favorable.
What sample size do I need?
It depends on your baseline rate and the smallest difference you want to detect. Use a calculator and plan before launching.
Can I test with low traffic?
Yes, but test large changes and use higher-volume metrics, or accept that you will only detect big effects.
Should I always test?
Test where the decision is meaningful and traffic allows. Not every change needs an experiment.
Key Takeaways
Write a hypothesis, choose one primary metric tied to lead quality, size the test before starting, run it in full weeks, and record what you learned. A disciplined testing roadmap compounds: each answer improves the next question.
Ready to put this into practice? Talk to our team about building a testing roadmap for your paid campaigns.